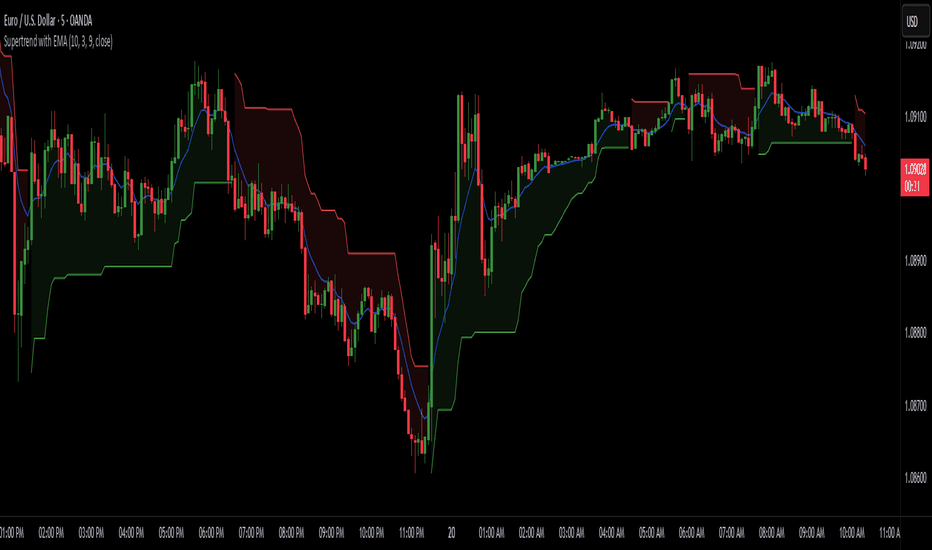
Market Insights Using the 200-Day Moving Average for Analysis
The financial markets are a dynamic playing field where investors strive to make informed decisions. Tools and indicators occupy a central role in navigating the complexities of trading and investing. Among these tools, the 200-day moving average (200 DMA) has emerged as one of the most widely used and reliable indicators for understanding market trends. Whether you are a long-term investor or engaged in active tick trading, the 200-day moving average can provide crucial insights into market behavior.
This article will delve deeply into the workings of the 200-day moving average, how it is used in market analysis, its relevance for tick trading and long-term strategies, and its limitations. By the end, you’ll gain a better understanding of how this indicator can help you make more informed investment decisions.
What is the 200-Day Moving Average?
The 200-day moving average is a technical indicator that helps traders and investors identify long-term market trends. It is the average closing price of a security, index, or asset over the past 200 trading days. As a “moving” average, it updates daily, dropping the oldest data point and adding the latest closing price to keep the average current.
The primary role of the 200 DMA is to smooth out price fluctuations and filter out daily market noise, enabling a clearer view of the overarching trend. In financial markets, the 200 DMA is often referred to as a trend filter because it effectively distinguishes between bullish (upward) and bearish (downward) markets.
When the price of a security is above its 200-day moving average, it is generally considered to be in an uptrend. Conversely, when the price falls below the 200 DMA, it may signal a downtrend. This simplicity makes it an essential tool for market participants of all skill levels.
Why is the 200-Day Moving Average Important?
The popularity of the 200-day moving average stems from its ability to provide a reliable gauge of market sentiment and direction. Here are the key reasons it holds such significance:
1. Long-Term Perspective
The 200 DMA provides a long-term view of a security’s price trend, which helps investors identify the overall health of the market. Unlike shorter moving averages, such as the 50-day or 20-day moving averages, the 200 DMA focuses on macro trends, making it ideal for long-term investing strategies.
2. Reliable Support and Resistance
The 200-day moving average often acts as a significant point of support in bull markets and resistance in bear markets. Traders monitor how prices react to the 200 DMA closely. If the price bounces off the average and remains above it, the moving average can act as a price floor; a break below it may indicate a bearish reversal.
3. Widely Followed Benchmark
Many institutional investors, hedge funds, and retail traders track the 200 DMA. This collective attention reinforces its significance and may create self-fulfilling trends. For example, when a large number of traders perceive a breach of the 200 DMA as bearish, sell orders may follow, driving prices lower.
Applying the 200-Day Moving Average in Trading Strategies
For Long-Term Investors
Long-term investors utilize the 200 DMA to time their entries and exits in the market. If a stock, index, or ETF is consistently trading above its 200 DMA and showing signs of upward momentum, it is often regarded as a buy signal. On the flip side, when the price falls and stays below the trend line, it could indicate a bearish environment and an opportunity to exit.
For instance, during market corrections or bear markets, investors may use the 200 DMA as a signal to reduce risky assets and move toward safer investments like bonds or cash. When prices recover and regain the 200 DMA, that may serve as a re-entry signal into equities.
For Tick Trading and Other Short-Term Strategies
While the 200-day moving average is typically used for long-term analysis, it has applications in tick trading and short-term strategies as well. Tick traders, who monitor price changes on very short timescales (e.g., every second or minute), use the 200 DMA as a reference point for major support or resistance areas.
Although tick trading primarily relies on shorter moving averages or real-time data, identifying the proximity of the price to the 200 DMA can provide critical context. For example, during a volatile trading session, tick traders may avoid going short if the price is approaching the 200-day moving average as support.
Golden Cross and Death Cross
Two popular trading signals using the 200 DMA include the golden cross and the death cross:
– Golden Cross: This occurs when the 50-day moving average crosses above the 200-day moving average, signaling a bullish trend.
– Death Cross: This occurs when the 50-day moving average crosses below the 200-day moving average, indicating bearish sentiment.
These crossover points are widely monitored by traders for potential entry or exit signals.
Limitations of the 200-Day Moving Average
While the 200-day moving average is powerful, it is not foolproof. Here are some limitations to keep in mind:
1. Lagging Indicator
Being a moving average, the 200 DMA is a lagging indicator, as it reflects past price data rather than predicting future performance. It works best in trending markets but can generate false signals during sideways or range-bound price movements.
2. Not Ideal for Volatility
Highly volatile assets might frequently cross above and below the 200 DMA, leading to confusion and unreliable signals. In such cases, combining the 200 DMA with other technical indicators like RSI or MACD can provide confirmation.
3. Ignored Fundamentals
The moving average solely focuses on price trends and does not account for fundamentals such as earnings reports or macroeconomic developments. Combining technical analysis with fundamental research offers a more comprehensive view.
Final Thoughts
The 200-day moving average is one of the simplest and most effective tools for identifying market trends. Whether you’re engaged in tick trading or long-term investing, this versatile indicator can act as your compass in navigating the highs and lows of financial markets. However, like any tool, its success depends on how it is used. The 200-day moving average should be part of a broader trading strategy that includes other indicators, sound risk management, and awareness of external market factors.
By understanding the strengths and limitations of the 200 DMA, traders and investors can harness its insights to make informed, disciplined decisions. In the ever-changing world of financial markets, the 200-day moving average continues to stand the test of time as a trusted ally.

Leave a Reply
Want to join the discussion?Feel free to contribute!