Saudi Arabia Entertainment and Amusement Market Forecast 2025–2033: Trends, Segmentation, and Strategic Insights

Saudi Arabia Entertainment and Amusement Market Growth Insights (2024–2033)

Saudi Arabia Entertainment and Amusement Market to Reach US$ 6.10 Billion by 2033, Driven by Technological Innovations and Increasing Disposable Incomes

Riyadh, Saudi Arabia – The Saudi Arabia Entertainment and Amusement Market is poised for rapid growth, with projections indicating it will reach US$ 6.10 billion by 2033, up from US$ 2.46 billion in 2024. This growth is driven by a compound annual growth rate (CAGR) of 10.61% from 2025 to 2033. The sector is increasingly benefiting from technological advancements, especially in virtual reality (VR) and augmented reality (AR), which are transforming how consumers engage with entertainment.

The Saudi Arabian government’s Vision 2030, designed to diversify the economy away from oil dependency, plays a key role in shaping the entertainment and amusement landscape. Large-scale investments, infrastructure development, and the flourishing tourism sector are driving the growth of leisure experiences, including theme parks, cinemas, malls, and gaming centers.

Key Drivers of Market Growth:

  1. Technological Advancements: The integration of VR, AR, and high-definition technologies into entertainment experiences has captivated audiences, offering immersive and dynamic interactions across entertainment destinations.
  2. Infrastructure Investments: Mega-projects like NEOM, Qiddiya, and the Red Sea Project are advancing Saudi Arabia’s entertainment infrastructure, with family entertainment centers, amusement parks, and cultural spaces springing up across the Kingdom.
  3. Young Population and High Spending: With over 60% of the population below the age of 34, Saudi Arabia’s youthful demographic is a primary driver of demand for entertainment. Consumers are spending more on leisure activities, particularly in amusement parks, cinemas, and live events.
  4. Government Initiatives: Vision 2030 and various public-private partnerships are spurring growth in the entertainment sector. The lifting of the 35-year cinema ban in 2017 and projects like Qiddiya are accelerating the development of world-class entertainment facilities.

Challenges to Market Growth:

Despite the promising growth prospects, the Saudi Arabian entertainment sector faces challenges, including regulatory complexities, dependency on tourism, and the need to balance entertainment with cultural and religious sensitivities in cities like Makkah.

Market Segmentation Insights:

  • Type of Entertainment Destination: Cinemas and theatres, amusement parks, malls, gaming centers, and others are key destinations for consumers.
  • Source of Revenue: Revenue streams include tickets, food and beverages, merchandise, advertising, and others.
  • City-wise Analysis: Riyadh, Jeddah, Makkah, Dammam, and other regions each contribute uniquely to the market, with Riyadh and Jeddah emerging as key growth hotspots.

New Publish Reports

Top Companies Driving Market Innovation:

  • Al Hokair Group
  • Fakieh Group
  • Saudi Aramco Amusement Park
  • E-PLUS (Event Plus)
  • Time Entertainment
  • First Entertainment Company

Market Outlook: The Saudi Arabia Entertainment and Amusement Market is expected to continue flourishing, driven by increasing investment in infrastructure, government support, and the growing demand for diverse and immersive entertainment experiences. By 2033, the market will not only see technological advancements but also the creation of new, globally competitive entertainment hubs.


Frequently Asked Questions (FAQs)

1. What is the current size of the Saudi Arabia Entertainment and Amusement Market?

  • The Saudi Arabia Entertainment and Amusement Market is currently valued at US$ 2.46 billion in 2024 and is projected to reach US$ 6.10 billion by 2033.

2. What are the primary drivers of growth in the Saudi Arabia entertainment sector?

  • Growth is driven by technological innovations (especially in VR and AR), large-scale infrastructure investments like NEOM and Qiddiya, a young and high-spending population, and government initiatives under Vision 2030.

3. How has Vision 2030 impacted the entertainment sector?

  • Vision 2030 has fueled growth by diversifying the economy, lifting the 35-year cinema ban, and launching projects like Qiddiya and the Red Sea Project, which are creating world-class entertainment facilities.

4. Which cities in Saudi Arabia are contributing the most to the entertainment market?

  • Riyadh, Jeddah, Makkah, and Dammam are the primary cities driving market growth, with Riyadh and Jeddah seeing the largest investments in entertainment infrastructure.

5. What are the main revenue sources in the Saudi Arabian entertainment industry?

  • The key revenue sources include ticket sales, food and beverage purchases, merchandise, and advertising revenue across various entertainment destinations.

6. What challenges does the Saudi Arabian entertainment market face?

  • The industry faces challenges such as regulatory hurdles, reliance on tourism, and the need to balance entertainment development with cultural and religious sensitivities, especially in cities like Makkah.

7. What types of entertainment destinations are most popular in Saudi Arabia?

  • Popular entertainment destinations include cinemas, amusement parks, malls, gaming centers, and cultural spaces.

8. Which companies are leading the entertainment market in Saudi Arabia?

  • Key players in the Saudi Arabian entertainment market include Al Hokair Group, Fakieh Group, Saudi Aramco Amusement Park, E-PLUS (Event Plus), and Time Entertainment.

9. How can businesses capitalize on opportunities in this market?

  • Businesses can capitalize on this growing market by investing in immersive technologies, expanding into new cities, and aligning with Vision 2030’s development initiatives in the entertainment sector.

For more details, custom reports, and analysis, businesses are encouraged to reach out to our experts for tailored insights into the Saudi Arabia Entertainment and Amusement Market.

United States Fast Food & Quick Service Restaurant Market

United States Fast Food & Quick Service Restaurant Market Forecast 2025–2033: Trends, Segmentation, and Strategic Insights

United States Fast Food & Quick Service Restaurant Market Trends & Summary

United States Fast Food & Quick Service Restaurant Market to Reach US$ 345.6 Billion by 2033, Growing at a CAGR of 3.74%

The United States Fast Food & Quick Service Restaurant (QSR) market, valued at US$ 248.8 billion in 2024, is expected to experience robust growth over the next decade. The market is projected to reach US$ 345.6 billion by 2033, with a compound annual growth rate (CAGR) of 3.74% from 2025 to 2033. The growth is driven by changing consumer lifestyles, the increasing popularity of digital ordering, and the demand for convenient, affordable dining options.

Fast food and QSRs have become an integral part of American food culture, offering customers a quick, efficient dining experience. Major players like McDonald’s, Subway, Taco Bell, and emerging brands focusing on healthier and plant-based options are fueling the market’s expansion. The integration of technology, including mobile ordering, drive-thru innovations, and loyalty programs, has further streamlined the customer experience and contributed to market growth.

Key Trends and Growth Drivers:

  1. Demand for Convenience and On-the-Go Eating: As busy lifestyles continue to prevail in the United States, the need for quick, convenient meals has led to a surge in QSR popularity. Drive-thru service, mobile ordering, and third-party delivery services like Uber Eats and DoorDash have made fast food even more accessible, catering to consumers looking for a quick and easy meal.
  2. Healthier Menu Options: With an increasing focus on health and wellness, QSRs are expanding their menus to include plant-based, low-calorie, and organic food options. Major brands like McDonald’s, Burger King, and Subway have embraced this shift to attract health-conscious customers, offering more nutritious choices alongside traditional fast food offerings.
  3. Technological Advancements and Digital Ordering: The incorporation of technology in QSRs has revolutionized the industry. Automated self-service kiosks, AI-driven ordering systems, and mobile payment solutions have enhanced the speed and efficiency of service, contributing to higher customer satisfaction and loyalty.

Challenges Facing the Market:

Despite its growth, the U.S. fast food and QSR market faces several challenges. Rising food and labor costs, including increased wages and supply chain disruptions, have put pressure on profit margins. Additionally, intense competition and market saturation have forced companies to continually innovate their offerings and marketing strategies.

New Publish Reports

Market Segmentation:

  • Product: Hamburgers, Sandwiches, Pizza, Mexican Cuisine, and Others
  • Region: East, West, North, South

Regional Insights:

  • East: Dominated by high-density urban areas like New York and Washington D.C., where convenience and digital ordering drive fast food consumption.
  • West: Known for its health-conscious culture, with a growing demand for plant-based and locally sourced ingredients.
  • North: Features a mix of fast food chains and regional players, with a preference for warm, hearty foods like burgers and soups.
  • South: Rich in comfort food traditions, with a strong demand for fried chicken, barbecue, and hearty meals, alongside a growing trend for healthier options.

Conclusion:

The United States Fast Food & Quick Service Restaurant market is poised for continued growth, driven by evolving consumer preferences, technological innovation, and the expansion of healthier menu options. As the demand for convenience and quality increases, QSRs will continue to innovate and adapt to meet the diverse needs of American consumers.

FAQs:

1. What is the projected market size of the U.S. Fast Food & Quick Service Restaurant market by 2033?

  • The market is projected to reach US$ 345.6 billion by 2033, growing at a CAGR of 3.74% from 2025 to 2033.

2. What are the key drivers of growth in the U.S. Fast Food & Quick Service Restaurant market?

  • The primary drivers include the growing demand for convenience, healthier menu options, and the integration of digital ordering technologies.

3. How is digital ordering affecting the fast food industry?

  • Digital ordering has revolutionized the customer experience by providing greater convenience through mobile apps, self-service kiosks, and third-party delivery services, leading to higher customer satisfaction and faster service.

4. Which are the major product segments in the U.S. Fast Food & Quick Service Restaurant market?

  • The key product segments include hamburgers, sandwiches, pizza, Mexican cuisine, and other fast food offerings.

5. What challenges does the U.S. Fast Food & Quick Service Restaurant market face?

  • Rising food and labor costs, market saturation, and the need for constant innovation to maintain customer loyalty are key challenges.

6. What regional trends are observed in the U.S. Fast Food & Quick Service Restaurant market?

  • Regional trends include a strong demand for healthier options in the West, comfort foods in the South, and a focus on convenience in urban centers on the East Coast.

For more detailed insights and information, contact our analysts or request a customized report tailored to your needs.

What Are the Key Benefits of IoT in Agriculture Equipment?

The Future of Smart Farming: How IoT is Transforming Agriculture Equipment

Introduction

The agricultural industry is undergoing a major transformation with the integration of Internet of Things (IoT) technology. Smart farming, powered by IoT, is revolutionizing the way farmers manage their land, crops, and livestock. With the rise of automation, data analytics, and AI-driven insights, IoT is playing a crucial role in making agriculture more efficient, sustainable, and profitable. This article explores how IoT is transforming agricultural equipment and the future of smart farming.

The Role of IoT in Smart Farming

IoT in agriculture involves the use of sensors, devices, and network connectivity to monitor and manage farming activities in real-time. These interconnected devices collect valuable data, enabling farmers to make informed decisions and optimize agricultural processes. Some of the key benefits of IoT in agriculture include:

Precision farming – Using real-time data to optimize resource usage, reduce waste, and enhance crop yields.

Automated equipment – Enabling machinery to perform tasks with minimal human intervention.

Remote monitoring – Allowing farmers to oversee their operations from anywhere.

Predictive maintenance – Reducing downtime and maintenance costs of farming equipment.

Improved sustainability – Enhancing water conservation and reducing the use of pesticides and fertilizers.

IoT-Powered Agriculture Equipment

According to a Agriculture Equipment Market report, the industry is expected to grow significantly in the coming years. IoT is being integrated into various types of agricultural equipment to improve efficiency and productivity. Some of the most notable smart farming equipment includes:

Smart Tractors

Traditional tractors are being replaced by autonomous and semi-autonomous models equipped with IoT sensors, GPS, and AI algorithms. These tractors can navigate fields, plant seeds, and apply fertilizers with high precision, reducing labor costs and increasing efficiency.

Drones for Precision Agriculture

Drones equipped with high-resolution cameras and multispectral sensors provide farmers with real-time aerial data. This data helps in assessing crop health, detecting diseases, and optimizing irrigation systems. By leveraging IoT, farmers can automate drone flights and integrate data analytics for better decision-making.

Automated Irrigation Systems

Water scarcity is a major concern in agriculture. IoT-powered irrigation systems use soil moisture sensors and weather forecasts to determine the optimal watering schedules. These systems reduce water waste and ensure crops receive the right amount of hydration, leading to improved yields.

Livestock Monitoring Systems

IoT-enabled wearables for livestock provide real-time data on animal health, location, and behavior. These devices help farmers detect illnesses early, optimize feeding schedules, and improve overall farm management. GPS trackers also assist in monitoring the movement of cattle and preventing theft.

Smart Greenhouses

IoT-powered greenhouses use climate control systems to adjust temperature, humidity, and lighting based on real-time sensor data. This ensures optimal growing conditions and increases crop production efficiency while minimizing energy consumption.

Automated Harvesting Machines

IoT-driven harvesting machines are designed to identify ripe crops and harvest them with precision. These machines use AI and machine learning to differentiate between mature and immature crops, ensuring better quality and reducing manual labor dependency.

The Impact of IoT on Agricultural Productivity

The integration of IoT in farming has resulted in significant improvements in productivity, efficiency, and sustainability. Some of the key impacts include:

Increased Crop Yields

By utilizing IoT sensors and predictive analytics, farmers can monitor soil conditions, weather patterns, and plant health in real-time. This data-driven approach allows for timely interventions, leading to higher crop yields.

Cost Reduction

Smart farming minimizes the need for manual labor, optimizes resource usage, and reduces maintenance costs of equipment through predictive maintenance. This leads to significant cost savings for farmers.

Enhanced Sustainability

IoT helps in reducing the environmental impact of agriculture by optimizing water and fertilizer usage, minimizing chemical runoff, and promoting eco-friendly farming practices.

Improved Decision-Making

With access to real-time data, farmers can make informed decisions regarding crop rotation, pest control, and resource allocation. This leads to better farm management and higher profitability.

Challenges and Considerations

Despite its numerous advantages, the adoption of IoT in agriculture comes with challenges that need to be addressed for widespread implementation.

High Initial Investment

The cost of implementing IoT-enabled agricultural equipment can be high, making it difficult for small-scale farmers to adopt the technology.

Data Security and Privacy

With large amounts of data being collected, cybersecurity threats and data breaches become a concern. Ensuring robust security measures is crucial for protecting sensitive farm data.

Connectivity Issues

Many rural farming areas lack reliable internet connectivity, which is essential for real-time data transmission and remote monitoring.

Technical Knowledge Gap

Farmers need training and technical expertise to effectively use IoT-based farming solutions. Bridging this knowledge gap is necessary for successful implementation.

The Future of IoT in Agriculture

The future of smart farming looks promising, with continuous advancements in IoT technology shaping the agricultural landscape. Some of the key trends that will drive the future of IoT in agriculture include:

AI and Machine Learning Integration

AI-powered predictive analytics will enhance decision-making, automate complex processes, and improve efficiency in farming operations.

5G Connectivity

The rollout of 5G networks will provide faster and more reliable connectivity, enabling real-time data processing and seamless communication between IoT devices.

Blockchain for Agricultural Supply Chain

Blockchain technology will enhance transparency and traceability in the agricultural supply chain, ensuring fair trade and reducing fraud.

Increased Adoption of Autonomous Farming Equipment

Fully autonomous farming equipment will become more prevalent, reducing human intervention and increasing operational efficiency.

Smart Farming as a Service (SFaaS)

Farmers will have access to IoT-based solutions through subscription models, making advanced technology more accessible and affordable.

IoT is revolutionizing agriculture by making farming more efficient, sustainable, and profitable. With smart tractors, automated irrigation systems, AI-powered analytics, and drone technology, farmers can optimize their operations and increase productivity. While challenges exist, the future of IoT in agriculture is bright, with continued advancements driving innovation in smart farming. By embracing IoT, the agricultural sector can ensure food security, enhance sustainability, and pave the way for the farms of the future.

Europe Food Cans Market

Europe Food Cans Market Forecast 2025–2033: Trends, Segmentation, and Strategic Insights

Europe Food Cans Market Trends & Forecast (2025-2033)

The Europe Food Cans Market, valued at USD 8.73 billion in 2024, is poised to grow at a steady CAGR of 2.44%, reaching USD 10.82 billion by 2033. This growth is driven by several factors, including an increasing demand for long-shelf-life and convenient food packaging, expanding urbanization, and advancements in sustainable materials. Additionally, the European Union’s regulations promoting green packaging and the shift towards BPA-free cans are further boosting market growth.

Key Drivers of Market Growth:

  1. Convenience and Long Shelf-Life Foods: With the rise of fast-paced urban lifestyles, consumers are increasingly turning to ready-to-eat and processed foods. The long shelf life and minimal need for refrigeration make food cans an attractive packaging solution. A notable 35% increase in fast-food spending in metropolitan areas from 2022 to 2024 highlights the growing demand for convenient, time-saving food options.
  2. Sustainability Focus: There is a growing trend toward eco-friendly and BPA-free food cans. With a heightened focus on environmental concerns and increasing regulations on sustainability, consumers are becoming more conscious of their packaging choices, pushing food manufacturers to adopt recyclable and environmentally friendly materials.
  3. Processed Food Consumption Surge: The demand for processed and packaged food products in Europe is on the rise, with an emphasis on convenience and nutritional value. This is driving the consumption of canned goods, from vegetables and meat to ready meals and pet food.

Challenges in the Market: While the food cans market shows positive growth, challenges such as concerns over BPA and other toxic chemicals in packaging and competition from alternative packaging solutions like flexible pouches and glass jars persist. These challenges may impact market dynamics, but innovations in safer, more sustainable food can technologies are likely to mitigate these risks.

Country-Specific Insights:

  1. France: France’s food can market is expanding due to a surge in demand for a variety of canned goods, including vegetables and seafood, alongside a strong push for sustainable and BPA-free cans.
  2. Germany: Germany’s market growth is supported by strict recycling laws and a demand for high-quality, durable canned products. The acquisition of Helvetia Packaging by Crown Holdings in 2023 is a notable development in the region.
  3. United Kingdom: The UK is witnessing increased demand for healthy and sustainable food cans, driven by a focus on organic and additive-free food products.

New Publish Reports

Product Segments:

  • Aluminum Cans: Widely used for soups, vegetables, seafood, and ready meals due to their lightweight and recyclability.
  • Steel Cans: Preferred for canned pet food and meat products due to their strength and ability to provide excellent barrier protection.

Application Segments:

  • Ready Meals
  • Meat & Vegetables
  • Fish & Seafood
  • Pet Food & Others

Future Outlook: The Europe Food Cans Market is expected to experience robust growth due to rising consumer preference for convenient, sustainable food packaging, supported by regulatory initiatives and growing eco-consciousness. Innovations in food preservation, along with the continuous rise in processed food consumption, will likely fuel the demand for food cans throughout the region.

For more detailed insights and customization, feel free to reach out to our analysts.


FAQs: Europe Food Cans Market

  1. What is the current size of the Europe Food Cans Market?
    • The market is valued at USD 8.73 billion in 2024 and is expected to reach USD 10.82 billion by 2033, growing at a CAGR of 2.44%.
  2. What factors are driving the demand for food cans in Europe?
    • Key drivers include the increasing demand for convenient, long-shelf-life foods, urbanization, eco-friendly packaging, and growth in ready-to-eat meals.
  3. How do eco-friendly and BPA-free cans influence the market?
    • Environmental concerns and regulations promoting recyclable packaging have led consumers and manufacturers to favor BPA-free, eco-friendly food cans, boosting market growth.
  4. Which countries are expected to lead in market growth?
    • Countries such as France, Germany, and the United Kingdom are expected to contribute significantly due to strong consumer demand and sustainable packaging trends.
  5. What challenges does the Europe Food Cans Market face?
    • Challenges include concerns about toxic coatings like BPA and competition from alternative packaging solutions, such as flexible pouches and glass jars.
  6. What is the market share of aluminum versus steel cans?
    • Aluminum cans dominate the market due to their recyclability and lightweight nature, while steel cans are primarily used for pet food and meat due to their strength.
  7. How significant is the demand for processed food in this market?
    • The demand for processed and packaged foods is a key driver of the food cans market, particularly in urban areas, where convenience is highly valued.
  8. How do consumer preferences for organic and preservative-free products impact the market?
    • The rise in health-conscious consumers opting for organic and preservative-free canned goods has led manufacturers to innovate and provide healthier product offerings.
United States Contact Lenses Market

United States Contact Lenses Market Forecast 2025–2033: Trends, Segmentation, and Strategic Insights

United States Contact Lenses Market Trends & Forecast 2025-2033: A Visionary Future with a Projected CAGR of 4.72%

April 2025 – The United States contact lenses market is projected to grow from US$ 3.09 billion in 2024 to US$ 4.67 billion by 2033, with a robust CAGR of 4.72%. This growth is fueled by an increasing demand for corrective vision solutions, the rising popularity of cosmetic contact lenses, and continuous technological advancements in lens materials and designs.

According to a recent report by Renub Research, the market for contact lenses in the U.S. is diverse, spanning across various materials (Gas Permeable, Silicone Hydrogel, Hybrid), usage patterns (Daily Disposable, Disposable, Frequently Disposable, and Traditional Reusable Lenses), and applications (Vision Correction and Cosmetic). Additionally, advancements in technology, including the development of smart lenses and improved comfort materials, are driving consumer adoption of contact lenses.

Growth Drivers of the United States Contact Lenses Market:

  1. Rising Prevalence of Visual Impairments: With approximately 12 million people over the age of 40 in the U.S. suffering from visual impairments, the demand for corrective vision solutions is on the rise. This includes both older adults experiencing age-related vision changes and younger individuals seeking more active, comfortable alternatives to glasses.
  2. Technological Advancements: The United States contact lenses market is benefiting from innovations in lens technology. For instance, advanced materials like silicone hydrogel and gas-permeable lenses are offering better oxygen permeability, which reduces irritation and provides extended comfort. Additionally, developments in smart contact lenses, including wireless sensors for health monitoring, are pushing the boundaries of what’s possible in vision care.
  3. Support for Research and Development: Government initiatives, including grants for vision care and research, have also contributed to market growth. This fosters further innovation in the contact lenses industry, including the development of specialized lenses for conditions such as astigmatism and presbyopia.
  4. Growth in Online Sales: The increasing shift towards online shopping, accelerated by the pandemic, has expanded the accessibility of contact lenses. Consumers now enjoy the convenience of comparing brands, prices, and ordering directly from home, which is reshaping the retail landscape for vision correction solutions.

New Publish Reports

Key Market Challenges:

  1. Risk of Eye Infections and Health Complications: Despite advances in technology, improper care, and unsanitary lens handling can lead to eye infections and other health issues. This poses a challenge to the market, as safety and hygiene concerns remain a priority for consumers.
  2. High Cost of Specialty Lenses: The cost of specialty lenses, particularly those for astigmatism or presbyopia, can be prohibitive for some consumers. Even with the growing popularity of daily disposables, long-term usage remains more expensive than eyeglasses, which could limit access for certain demographics.

Segment Overview:

  • Material: The market is segmented into Gas Permeable, Silicone Hydrogel, and Hybrid lenses, with Silicone Hydrogel lenses leading in terms of comfort and oxygen permeability.
  • Usage: Includes Daily Disposable, Disposable, Frequently Disposable, and Traditional (Reusable) Lenses. The daily disposable category is seeing the fastest growth due to convenience and hygiene benefits.
  • Design: Spherical, Toric, and Multifocal lenses cater to different vision needs, with Toric lenses growing in demand for astigmatism correction.
  • Application: Vision correction lenses dominate the market, though cosmetic lenses, such as colored and decorative lenses, are gaining popularity.
  • Distribution Channel: Contact lenses are sold through online pharmacies, retail pharmacies, and hospital pharmacies.

Prominent Players in the Market:

  • Bausch & Lomb
  • Alcon
  • Carl Zeiss Meditec AG
  • The Cooper Companies, Inc.
  • Hoya Corporation
  • EssilorLuxottica
  • Menicon Co. Ltd
  • SynergEyes Inc.

Conclusion:

The U.S. contact lenses market is poised for sustained growth due to increasing demand for corrective solutions, the rise of cosmetic lenses, and technological breakthroughs. While challenges such as hygiene concerns and cost remain, the market is expected to benefit from continued advancements and greater consumer accessibility through online platforms.

For further details and analysis, contact Renub Research at .


FAQs:

1. What is the projected growth of the U.S. contact lenses market? The U.S. contact lenses market is expected to grow from US$ 3.09 billion in 2024 to US$ 4.67 billion by 2033, with a CAGR of 4.72%.

2. What are the key factors driving the growth of the contact lenses market? Key growth drivers include the increasing prevalence of visual impairments, advancements in contact lens technology, government support for R&D, and the rise of online sales platforms.

3. What are the most popular types of contact lenses in the U.S.? The most popular types are daily disposable lenses, followed by silicone hydrogel and gas-permeable lenses, especially for those with comfort or vision correction needs.

4. What challenges does the U.S. contact lenses market face? The main challenges include the risk of eye infections due to improper lens care and the high cost of specialty lenses, which may limit access for some consumers.

5. Who are the major players in the U.S. contact lenses market? Some of the key players in the U.S. market include Bausch & Lomb, Alcon, The Cooper Companies, Inc., EssilorLuxottica, and Menicon Co. Ltd.

6. How are technological advancements impacting the contact lenses market? Technological advancements are improving the comfort, durability, and functionality of contact lenses. Innovations like silicone hydrogel materials and smart lenses with health-monitoring capabilities are driving the market forward.

7. What distribution channels are most popular for purchasing contact lenses? Consumers primarily purchase contact lenses through online pharmacies, retail pharmacies, and hospital pharmacies, with online platforms seeing significant growth due to convenience.

8. What is the market outlook for contact lenses in the U.S.? The market is expected to grow steadily, driven by an aging population with increasing vision correction needs, as well as technological innovations and greater accessibility through online sales.

9. Are cosmetic contact lenses popular in the U.S.? Yes, cosmetic contact lenses, including colored and decorative lenses, are gaining popularity, especially among younger consumers seeking aesthetic enhancements.

10. How does government support impact the contact lenses market? The U.S. government’s support for research, development, and vision care programs has fostered innovation and improved access to contact lenses, contributing to the market’s growth.

Join the Garbha Sankalp Fertility Workshop.

Join the Garbha Sankalp Fertility Workshop.


Your fertility healthcare buddy. As India’s ONLY and Trusted fertility support community, Fertility Dost aims to provide fertility care to over 10 Lakh couples by 2025. We Analyzed & Worked On Several Problem Factors That Appear On The Journey To Infertility.

Europe Biodiesel Market

Europe Biodiesel Market Forecast 2025–2033: Trends, Segmentation, and Strategic Insights

Europe Biodiesel Market Trends & Growth Outlook

Europe Biodiesel Market Set to Reach US$ 18.72 Billion by 2033, Driven by Renewable Energy Mandates and Technological Advancements

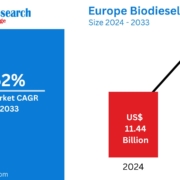
The European biodiesel market is witnessing significant growth, with an estimated size of US$ 18.72 billion by 2033, rising from US$ 11.44 billion in 2024. This represents a compound annual growth rate (CAGR) of 5.62% from 2025 to 2033. Several key factors are driving this growth, including increased adoption of renewable energy sources, supportive government policies, and a strong focus on sustainability.

A Clean and Renewable Energy Solution

Biodiesel, produced from vegetable oils, animal fats, or recycled cooking oils, is a renewable fuel offering a sustainable alternative to conventional diesel. Through the process of transesterification, oils are converted into fatty acid methyl esters (FAME), which can be blended with fossil fuels to create cleaner energy solutions for the transportation, power generation, and industrial sectors. This growing demand for cleaner fuel alternatives plays a vital role in reducing greenhouse gas emissions and enhancing Europe’s renewable energy strategy.

Growth Drivers: Renewable Energy Mandates & Technological Advancements

The European Union’s Renewable Energy Directive (RED II) is pushing the market forward by setting specific mandates for renewable fuels in the transportation sector, including a requirement for a minimum of 14% renewable energy in transport fuels by 2030. Additionally, technological advancements in biodiesel production are enhancing efficiency and expanding feedstock options, reducing production costs and enabling widespread adoption.

The emphasis on sustainability is also fueling demand, as biodiesel helps achieve carbon emission reduction targets while supporting circular economies. The European biodiesel market is rapidly becoming a key player in the energy transition, with increased government support and a growing public demand for green energy alternatives.

Challenges Facing the Market

Despite the positive growth prospects, the European biodiesel market faces significant challenges. Supply chain limitations, particularly concerning the availability of vegetable oils and animal fats, are creating instability in the raw materials required for biodiesel production. Moreover, biodiesel production costs are often higher than traditional diesel fuels, creating a competitive landscape where alternative renewable energy sources, such as hydrogen-based fuels, could pose a threat to biodiesel’s market share.

New Publish Reports

Outlook for the Future

The European biodiesel market continues to show promise as a cleaner energy source, particularly in countries like Germany, the UK, and France, where strong governmental support and a commitment to renewable energy are pushing the sector forward. Market expansion is expected to continue, with significant investments in technology and infrastructure.

Key Companies in the Market:

  1. Archer Daniels Midland Company
  2. Future Fuel
  3. Neste
  4. Renewable Energy Group, Inc.
  5. Bunge Global SA
  6. Wilmar
  7. Shell

For more information or to receive a custom market analysis, please contact our analysts.


Frequently Asked Questions (FAQs) – Europe Biodiesel Market

1. What is the estimated size of the Europe biodiesel market by 2033?
The Europe biodiesel market is expected to reach US$ 18.72 billion by 2033, growing from US$ 11.44 billion in 2024.

2. What factors are driving the growth of the biodiesel market in Europe?
Key growth drivers include renewable energy mandates, technological advancements in production efficiency, government policies promoting sustainability, and the shift towards greener fuel alternatives to reduce carbon emissions.

3. How does the European Union’s Renewable Energy Directive (RED II) affect the market?
RED II mandates that at least 14% of energy used in transportation must come from renewable sources by 2030, making biodiesel a key player in achieving these targets.

4. What are the challenges faced by the European biodiesel market?
Challenges include supply chain issues related to feedstock availability, higher production costs, and rising competition from other renewable energy alternatives, such as hydrogen-based fuels.

5. Which countries in Europe are leading in biodiesel production and consumption?
Countries such as Germany, United Kingdom, France, Italy, and Spain are major players in the European biodiesel market, driven by strong policies and increased public demand for cleaner energy sources.

6. What are the key applications of biodiesel in Europe?
Biodiesel is widely used in transportation, power generation, and industrial applications, including heating systems and machinery.

7. What feedstocks are primarily used for biodiesel production in Europe?
The primary feedstocks include vegetable oils (such as rapeseed oil) and animal fats.

8. How is technological advancement influencing biodiesel production?
Technological advancements have led to increased production efficiency, lowered costs, and the ability to use a broader range of feedstocks, enabling the growth of the biodiesel market in Europe.

9. Who are the major companies operating in the European biodiesel market?
Key players include Archer Daniels Midland Company, Future Fuel, Neste, Renewable Energy Group, Inc., Bunge Global SA, Wilmar, and Shell.

10. What is the expected growth rate for the European biodiesel market?
The market is expected to grow at a CAGR of 5.62% from 2025 to 2033.

United States Home Infusion Therapy Market Forecast 2025–2033: Trends, Segmentation, and Strategic Insights

United States Home Infusion Therapy Market to Double by 2033, Driven by Aging Population and Technological Advancements

The United States home infusion therapy market is projected to reach an estimated US$ 20.59 billion by 2033, growing from US$ 10.26 billion in 2024 at a CAGR of 8.05% between 2025 and 2033, according to a new report by Renub Research.

This rapid growth is fueled by the surging prevalence of chronic diseases, advancements in home healthcare technologies, and a paradigm shift toward patient-centric, cost-effective treatments delivered in the comfort of home.

💡 Market Overview

Home infusion therapy allows patients to receive intravenous (IV) or injectable treatments at home, reducing hospital stays and improving quality of life. Treatments include antibiotics, chemotherapy, hydration therapy, nutrition support, and more.

🔍 Key Growth Drivers

  • Rising Chronic Diseases: Conditions like diabetes, cancer, and cardiovascular diseases are prompting long-term treatment at home.
  • Technological Innovation: Portable infusion pumps and remote monitoring systems enhance patient safety and treatment precision.
  • Aging Population: By 2060, 23% of Americans will be 65+, fueling demand for at-home care solutions.
  • Personalized Care: Higher patient satisfaction and reduced infection risk are encouraging broader adoption.

🚧 Market Challenges

  • High Equipment Costs: Advanced devices and specialty medications require significant investment.
  • Workforce Shortages: The demand for trained nurses and pharmacists outpaces current availability.

New Publish Reports

🔬 Segment Highlights

  • Anti-Infective Therapy: Growing due to infections like sepsis requiring prolonged antibiotic care.
  • Chemotherapy at Home: Enhanced by portable devices, offering patients privacy and emotional well-being.
  • Infusion Pumps Market: Rising due to smart pumps with wireless monitoring—e.g., Infuzamed’s wearable pump launched in 2024.
  • IV Sets Market: Essential for safe home-based medication delivery, especially for chronic and post-op patients.

🌎 Regional Insights

  • California: Market expansion fueled by chronic disease prevalence and strong healthcare infrastructure.
  • New York: Growth supported by efforts to decongest hospitals and enhance rural healthcare.
  • Texas & Florida: Large aging populations and healthcare accessibility initiatives are driving adoption.

🏢 Key Players

  • Baxter International Inc.
  • Becton Dickinson and Company
  • Eli Lilly & Company
  • Fresenius SE & Co. KGaA
  • ICU Medical Inc.
  • Option Care Health Inc.
  • Terumo Corporation

📈 Report Details

  • Forecast Period: 2025–2033
  • Segments: By Application (Anti-Infective, Chemotherapy, etc.), Product (Pumps, IV Sets, etc.), and 29 U.S. States
  • Customization Available: Region-specific trends, competitive analysis, trade insights, and more

📞 Contact Us

To learn more or to request custom insights, contact Renub Research analysts today. Discover how your organization can leverage the latest market trends to stay ahead.


Frequently Asked Questions (FAQs)

1. What is the projected size of the U.S. home infusion therapy market by 2033?

The market is forecasted to reach US$ 20.59 billion by 2033.

2. What is the expected CAGR for this market?

From 2025 to 2033, the market is expected to grow at a CAGR of 8.05%.

3. Which factors are driving market growth?

Key drivers include the rise in chronic diseases, aging population, technological advancements, and increasing demand for cost-effective and personalized home care.

4. How does home infusion therapy benefit patients?

Patients benefit from enhanced comfort, reduced hospital visits, lower infection risk, improved treatment adherence, and cost savings.

5. What are the major challenges in the market?

High costs of infusion devices and a shortage of skilled professionals are primary challenges.

6. Which application areas are covered in the market analysis?

Applications include:

  • Anti-Infective
  • Endocrinology
  • Hydration Therapy
  • Chemotherapy
  • Enteral and Parenteral Nutrition
  • Specialty Pharmaceuticals
  • Others

7. What role does technology play in market expansion?

Technological innovations like wearable infusion pumps and real-time monitoring systems are increasing treatment safety, flexibility, and efficiency at home.

8. Which states are analyzed in the report?

29 states including California, Texas, New York, Florida, Illinois, and others are covered, with regional insights on demand, infrastructure, and healthcare policies.

9. Why is the aging population important for this market?

Older adults are more likely to suffer from chronic conditions and prefer home-based treatment, making them a key consumer group.

10. Who are the leading companies in the U.S. home infusion therapy market?

Top players include Baxter, Fresenius, Option Care Health, and ICU Medical, among others.

What is TPO Roofing? Everything you need to know

Thermoplastic Polyolefin or TPO Roofing is one of the most widely consumed roofing materials in the United States. It is a single-ply roofing layer that is applied over flat roofs. It is gaining immense popularity because it has a natural reflective surface that can reflect ultraviolet rays.

It is noteworthy to mention that, according to the National Roofing Contractors Association, TPO Roofing has about 40% to 42% of the commercial market share. They are normally manufactured in the categories of 10, 12, or 20 feet wide.

What is TPO Roofing composed of?

It is only one sheet (membrane) of Roofing. This single sheet is composed of three different layers, which are as follows:

  • The top and base layer is made up of thermoplastic polyolefin. These sheets are made from ethylene propylene rubber and other fillers such as Fiberglass, carbon fiber, or talc. These materials give the TPO structure the required strength and flexibility. 
  • The middle layer is made from polyester reinforced fabric, which is also known as scrim. This gives it more flexibility, thus the ability to be rolled out and installed easily on any roof.

What to Consider When Acquiring TPO  Roof Material?

As TPOs are constructed in wide sheets, so greater the width, the fewer adjustments will be required. This will make your roof more strong and durable overall. On top of that, the installation process will speed up. 

To get the most favourable outcome for the roofing installation, here are some things to consider before acquiring it:

1) Precisely calculate measurements

Accurate Measurements can help you in the short and long term as well. Firstly, accurate measurements will ensure that Construction Cost Estimating Services are accurate. This will make the material acquisition process more efficient, eliminating any chances of over- or under-estimation.

2) TPO Thickness

At the time of getting TPO sheets, you have to make sure that they will be enough for your set requirements. Either for a Residential project or commercial. A tip for you is that the top layer must be the thickest to get the most out of your TPO roof.

Therefore, carefully conducted Construction Takeoff Services, assuring that your needs are met for your specifications.

3) How well can a TPO sheet be welded?

A premium quality TPO material can be easily welded. Furthermore, if they are easily weldable, then the consistency among the sheets will be seamless. This consistency can even be achieved at different temperatures as well.

TPO Roofing Costs in 2025

For an average commercial project of 20000 square feet typically costs around $5 – $ 10 per square foot. This figure is composed of combining both materials and labour. 

However, as of the current prices, they are higher because of the increasing demand. It has increased to $6 – $ 12 and can even be higher.

Hence, choose SMA Estimating LLC for your Roofing Estimating Services. They will make sure that your roofing tasks are up to the mark with cost-effective techniques. They do it by carefully assessing your roofing requirements and applying the most suitable roof. 

But what are the factors that impact the cost of TPO? Let’s have a look at them:

  • What is the size of your roof?
  • Is the access to your roof complicated?
  • What is the condition of your existing roof? (if any)
  • What grade or TPO sheet have you chosen?
  • What is your choice of insulation?

Is TPO Roofing Advantageous?

A TPO sheet can last up to 30 years if the installation is proper and it has been maintained regularly. That being said, there are quite a few perks of TPO Roofing as well, such as:

  • It can be highly fire-resistant because it is manufactured with fire-resistant chemicals.
  • A client has multiple options when it comes to insulating their roof
  • It is very reflective and can reflect heat and UV rays efficiently. In return, you will consume less energy in hot weather, saving money in the end
  • It is extremely flexible, which makes it adaptable to tears, punctures, and any other damage during installation.
  • It is environmentally friendly as it is 100% reliable

Let’s discuss some of TPO’s Roofing Disadvantages:

  • For some, specifically residential projects, clients still go with the norm, as they are more reluctant to try a new product 
  • Improper seams during the installation of roofs. It can arise because of the lack of proper equipment for the installation of roofs
  • If a TPO sheet is not manufactured with standard quality materials, it can result in inferior TPO sheets.

To Conclude 

In the end, TPO Roofing installation can be very effective with proper planning. In addition to that, this article provides you with valuable insights if you select TPO for your next project. It discusses in detail how a TPO Roof is created and what factors to consider in getting TPO sheets. Also, it mentions various pros and cons of TPO Roofing for your project.

Top MEP Estimating Software

Top MEP Estimating Software Solutions to Boost Accuracy & Profits

If you have been facing the problem of low bid hit ratio, then an MEP Estimating Software can help to change that. One of the main challenges that contractors face during bidding is coming up with an accurate budget. Inaccurate estimates are often due to errors in calculation or limited time. Software can help to solve both of these problems.

An estimating software allows users to calculate indirect and direct costs related to any type of construction project. But it does take a certain level of skill set to use them.

SMA MEP Estimate holds training programs to teach its estimators to use MEP Software. We are one of the best MEP estimating services providers who use AI-powered innovative tools to create estimates for our clients. Due to the accuracy of their estimates, their bid hit ratio is 98%. 

When you start to search for software, you will find that there are a lot of options available. This guide can help you narrow down your research and make the right choice.

Best MEP Estimating Software

Here is a list of some of the most popular MEP Estimating software to deal with the intricacies of the MEP system.

1) FastPipe

FastPipe is a software for mechanical and plumbing estimating. It can be used for residential, commercial or even industrial scale projects. It only requires payment once for a flat rate of $4,995. The payment structure is quite flexible if one wants to pay monthly, then that option is also available for $225.00 per month for the basic plan. FastPipe is ideal for professional Plumbing Estimating Services, but it might be too costly for a single individual. It has value for money as it can handle complex jobs. 

Features:

  • Fastpipe comes with a pricing catalogue for mechanical and plumbing components
  • One can easily make changes and modify it
  • It works well with many different formats, including PDFs.
  • Materials can be quantified directly on the digital blueprints, which helps to save time

2) FastDuct

FastDuct is a duct and HVAC estimating software. It is a popular choice among Mechanical Estimating Services, which use it to develop accurate financial budgets. 

FastDuct can cater to projects of every scale and size, from residential buildings to large industrial plants it can handle all sorts of data sets. 

Features:

  • It has a built in HVAC pricing guide that is updated over time
  • Labor rates are according to the standards, but can be modified
  • It helps to create precise calculations in a short period
  • Data can be exported to an Excel sheet
  • It allows customizations and alterations 

3) Trimble

Trimble is an electrical estimating cloud-based software. It is a BIM (Building Information Model) software that allows users to view and create 3D models, which enhances visual clarity on the project. Electrical Estimators use software for developing detailed and comprehensive plans for electrical projects. Through BIM, one can have a better view of the project.

Features:

  • Models can be managed and created easily
  • Automation saves time as simple tasks can be done quickly
  • Trimble can be easily accessed through a mobile 
  • It allows seamless integration with many other apps
  • It allows real time collaboration through cloud based access 

4) McCormick System

McCormick System is another MEP Estimating Software. It is mainly developed to deal with electrical projects. It can quantify material quickly by analyzing the measurements of the construction plan, so make sure that you submit the right designs. It can be used for electrical installation, repair or maintenance work on any type of building. It is widely used by electrical estimators to create estimates for different types of electrical projects.

Features:

  • One can easily customize and tailor assemblies
  • It comes with a pre-built database
  • Users can make changes in real time without any issues
  • It has unlimited job storage to store past construction projects
  • The job screen can be customized for bid management and reporting
  • It allows seamless integration with project management software 

Conclusion

In the end, finding and implementing the best MEP Estimating Software can make a huge difference for a project. Regardless of the size and complexity of computations, an MEP software can make the estimates fast and accurate. But what software to choose is the main question at hand? This article answers this question efficiently. It discusses some of the most impactful MEP software that can be applied to deliver MEP tasks more proficiently. It not only gives you a basic understanding of various software but also mentions their primary factors for which they are known.